The Python FLEXible object TRacKeR (PyFLEXTRKR) is a flexible atmospheric feature tracking software package. The software can track any 2D objects and handle merging and splitting explicitly. PyFLEXTRKR has specific capabilities to track convective clouds from a variety of observations and model simulations. The package uses Dask for scalable parallelization and has been optimized to work on large datasets including global kilometer-scale data. PyFLEXTRKR uses Xarray for I/O and writes netCDF files as tracking outputs.
Currently PyFLEXTRKR supports tracking:
- Individual convective cells,
- Mesoscale convective systems (MCSs),
- General atmospheric objects defined by customizable feature identification functions.
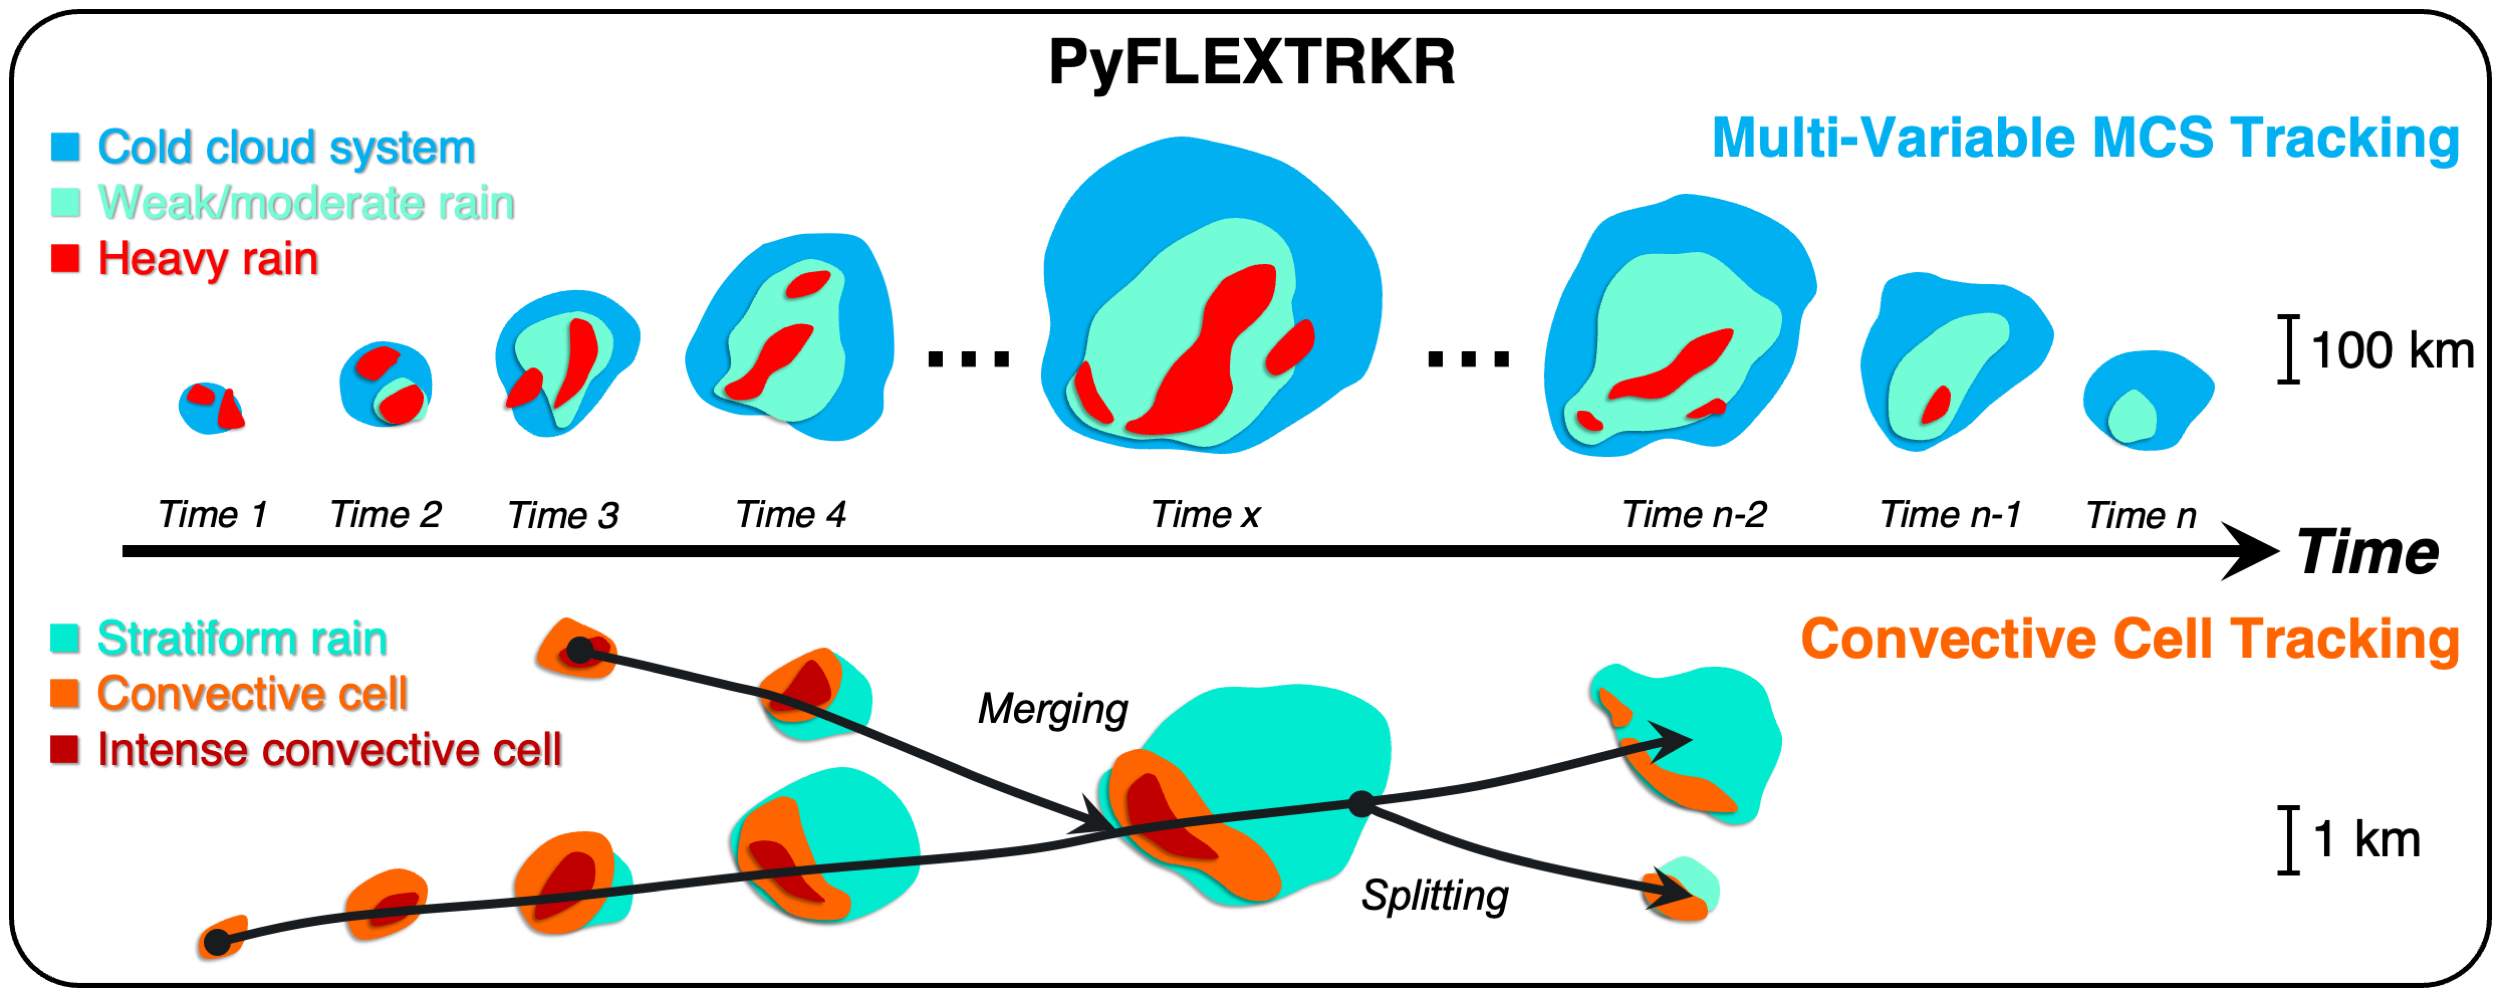
Tracking in PyFLEXTRKR primarily uses object overlap technique, with an option to use advection estimates (2D cross-correlation) to increase overlap probability. Largest overlap objects are tracked continuously, and smaller overlap objects are marked as merging/splitting.

Reference
Feng, Z., Hardin, J., Barnes, H. C., Li, J., Leung, L. R., Varble, A., & Zhang, Z. (2023). PyFLEXTRKR: a flexible feature tracking Python software for convective cloud analysis. Geosci. Model Dev., 16(10), 2753-2776, doi:10.5194/gmd-16-2753-2023
tobac (Tracking and Object-based Analysis of Clodus) is a scientific Python package for detecting, tracking, and analyzing clouds and other atmospheric phenomena. tobac is unique in its ability to track phenomena using any variable on any grid, including radar data, satellite observations, and numerical model output. Due to its modular and flexible design, tobac is a general toolset that can be used for tracking all kinds of atmosheric phenomena related to storm formation, from small scales (e.g. updrafts) to large scales (e.g. atmospheric rivers).
The main elements of tobac are:
- Data input and output - Xarray and pandas
- Data filtering - Gaussian smoothing and wave-length based filtering
- Feature detection - works in 3D and with multiple thresholds
- Segmentation of cloud areas and volumes - works in 3D and across different data sets (e.g. get the precipitation volume associated with detected clouds)
- Trajectory linking - uses propagation speed and works across periodic boundaries
- Object-based analysis and visualization - includes the identification of mergers and splitters in the track database
tobac developed with an open, multi-institutional international community, and has been built from the ground up in support of open science. Detailed documentation can be found here. Any user feedback is welcome and users are invited to leave commentsand questions in the GitHub discussion forum of tobac or, if it concerns bug reports or specific user requests, a GitHub issue. Release announcements, workshop and conference announcements, and other information of interest to the broader tobac users group are sent to the tobac core group mailing list. If you are interested in contributing to the development of tobac, users are invited to join the tobac developers mailing list.
References
Heikenfeld, M., Marinescu, P. J., Christensen, M., Watson-Parris, D., Senf, F., van den Heever, S. C., and Stier, P.: tobac 1.2: towards a flexible framework for tracking and analysis of clouds in diverse datasets, Geosci. Model Dev., 12, 4551–4570, https://doi.org/10.5194/gmd-12-4551-2019, 2019.
TOOCAN

TAMS (Tracking Algorithm for Mesoscale Convective Systems) is an MCS tracker and classifier. TAMS was originally developed for tracking and analyzing MCSs associated with African easterly waves (AEWs). The currently developed TAMS is a scientific Python package. TAMS uses the GeoPandas dataframe data structure to store polygon shapes of the elements to be tracked. It is a grid-independent MCS identifier and tracker, and as such, it can be applied for both simulated and observed MCSs. It is available to be installed via pip or conda/mamba.
TAMS has four main steps:
- Identify- Through Xarray or Pandas, cloud elements (CEs) that are MCS candidates via default criteria are identified through temperature thresholds (if using satellite data) or cloud top temperature proxy (model data)
- Tracking- Overlap method and optional cloud projection in the x direction
- Classification- Based on default criteria considering shape, size, and duration, each MCS is classified into one of four possible categories
- Assignment of rainfall (or variable of choice)- Through the use of the helper function ‘tams.data_in_contours’, a variable of choice can be added to each CE in order to study the MCS evolution across different statistical analysis and atmospheric variables
Currently, Identify, Assignment, and some post-processing can be done in parallel.
Settings
Users can choose outer and core thresholds of CEs for object detection, optionally define zonal projection velocity, and choose the % overlap threshold for time matching.
Helper functions and utilities
Users can use the eccentricity calculation function as a measure of the MCS shape. Other functions include plotting MCS tracks, loading sample MSG ch9 satellite data, and MPAS data. Jupyter Notebooks and examples are available for calculating brightness temperature from EUMETSAT, MPAS Cloud Top Temperature from OLR, and others.
References
Kelly M. Núñez Ocasio, Jenni L. Evans, and George S. Young. Tracking Mesoscale Convective Systems that are Potential Candidates for Tropical Cyclogenesis. Monthly Weather Review, 148(2):655 – 669, Feb 2020. URL: [https://journals.ametsoc.org/view/journals/mwre/148/2/mwr-d-19-0070.1.xml], (doi:10.1175/MWR-D-19-0070.1).
Kelly M. Núñez Ocasio, Jenni L. Evans, and George S. Young. A Wave-Relative Framework Analysis of AEW–MCS Interactions Leading to Tropical Cyclogenesis. Monthly Weather Review, 148(11):4657 – 4671, Nov 2020. URL: [https://journals.ametsoc.org/view/journals/mwre/148/11/MWR-D-20-0152.1.xml], (doi:10.1175/MWR-D-20-0152.1).
MOAAP